
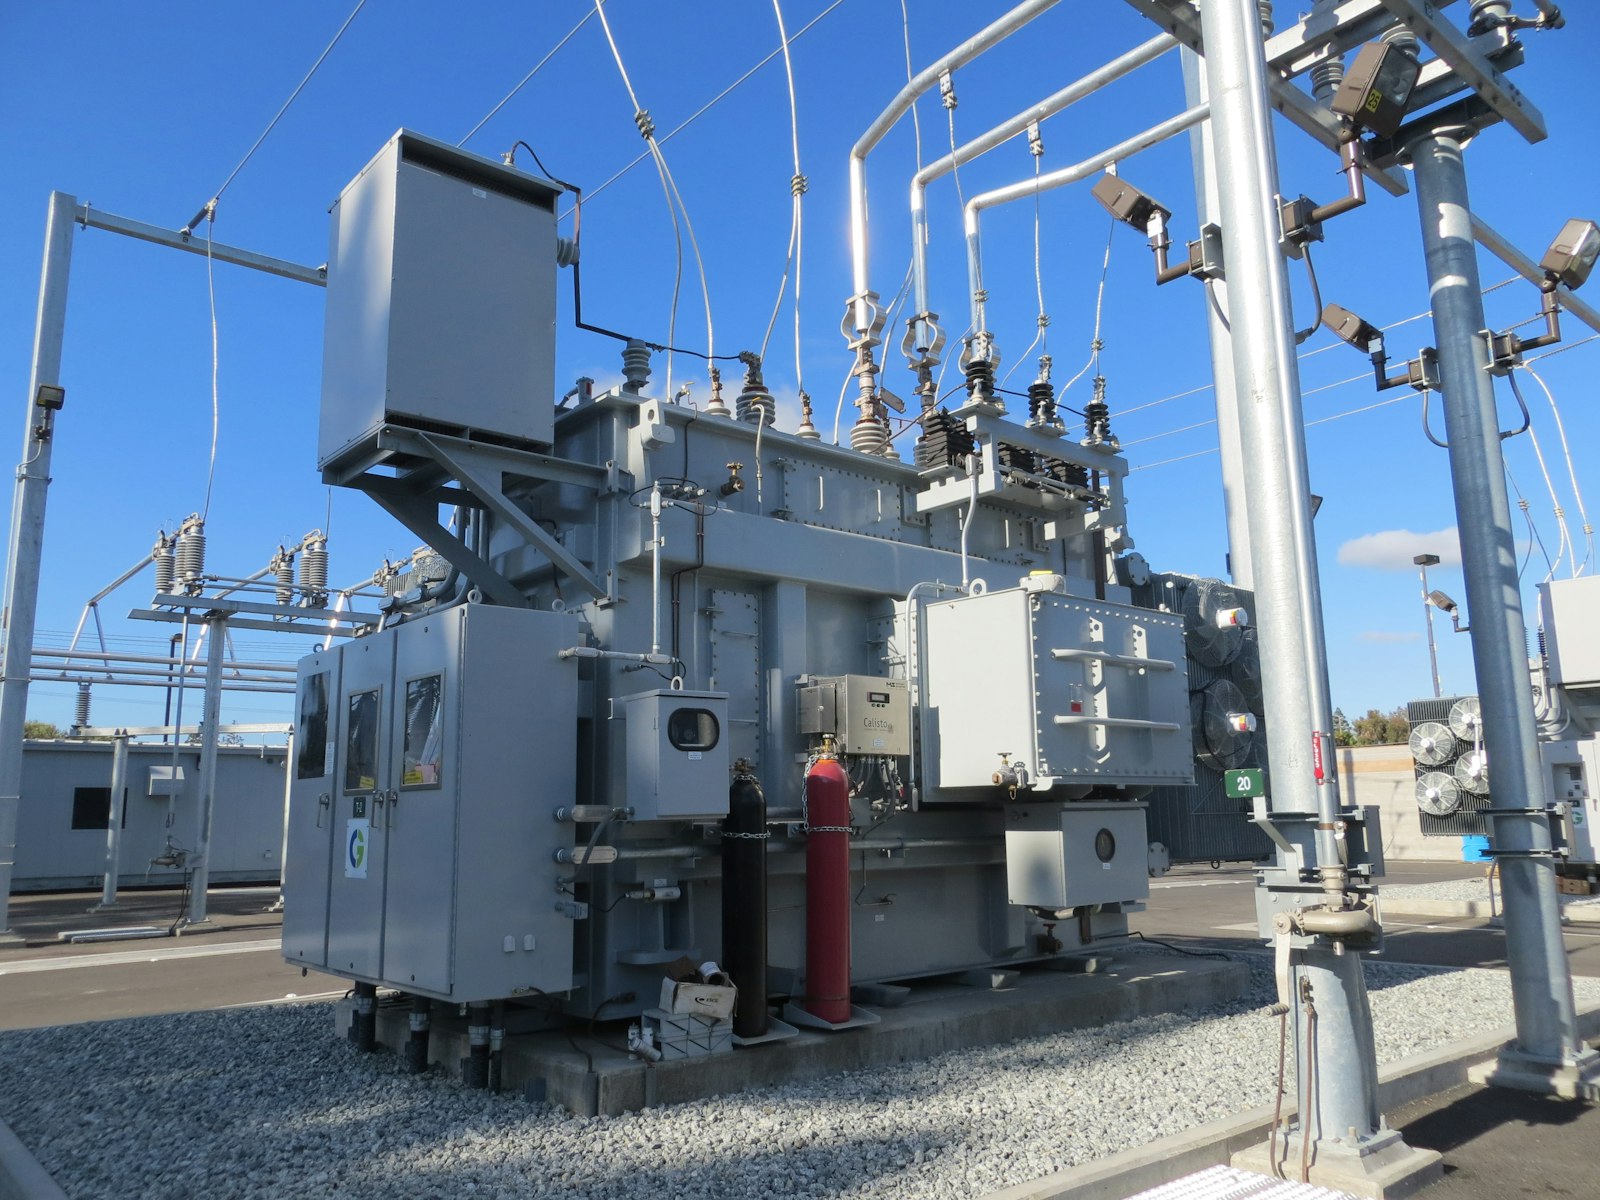
What a power flow study solves for
A power flow study, also called a load flow, solves the steady-state condition of an AC network. Given the topology, the impedance of every line and transformer, the load at every bus, and the output and voltage setpoint of every generator, it computes voltage magnitude and angle at each bus and real and reactive power on each branch. Most interconnection analysis derives from those two results.
For a developer the useful outputs are line and transformer loadings as a percentage of thermal rating, and bus voltages in per unit against the planning criteria band. A screen adds your project as a new generator or load at the candidate bus, re-solves, and compares before and after. The first branch to reach its rating sets the ceiling. Transient stability and harmonic studies are separate analyses, but thermal and voltage results drive most upgrade cost.
N-0, N-1, and the limits that bind
N-0 is the system with all elements in service. N-1 removes one element: a line, a transformer, a generator, or in some regions a double-circuit tower. Planning criteria require the grid to stay within thermal and voltage limits after any single contingency, so the utility tests your project against every credible N-1 case, and often N-1-1 or common-mode outages.
The binding constraint is rarely found in the N-0 case. The typical failure is a parallel path: when a neighboring line trips, your injection reroutes onto a weaker line that was fine in normal operation. A screen that checks only the substation you plan to connect to, without contingency analysis, tends to overstate headroom.
Voltage and short-circuit checks sit alongside thermal ones. Large injections on weak systems push voltages high at light load; large withdrawals pull them low. Reactive support from inverters or capacitor banks often fixes voltage cheaply, while a thermal overload usually needs a reconductor, a transformer replacement, or a new line. Every machine you add also raises fault current at nearby buses; a breaker whose interrupting rating is exceeded must be replaced before you energize.
Injection, withdrawal, and the base cases behind them
Injection studies model generation: your project pushes power into the grid and the question is how far it travels before a branch overloads or a voltage rises out of band. Withdrawal studies model load, including data centers and the charging side of storage. The same tools apply, but the stressed elements, critical hours, and relevant contingencies differ, and a site with generation headroom can have none for load.
Every study runs on a base case: a solved model of the grid for a specific future year and system condition. Summer peak is the classic case for thermal limits. Light-load and shoulder cases matter for injection because low demand leaves fewer places for power to go and voltages run high. Winter peak has become important in regions with electrified heating.
A base case also encodes which other projects exist. Utilities include prior-queued generation and planned upgrades as if in service; a screen that omits them finds headroom that is already spoken for. Storage is modeled in both directions, so a co-located hybrid needs a case where the battery charges from the grid as well as one where it discharges.
Why the POI and voltage level change the answer
The point of interconnection is not just a location. Connecting at 69 kV, 138 kV, or 345 kV places your project in different parts of the network with different thermal ratings, short-circuit strength, and contingency sets. Higher voltage systems usually offer more headroom, but substation work and gen-tie costs rise with voltage class.
Two POIs a few miles apart can produce opposite results. One may sit on a strong loop where injection spreads across several paths; the other may hang at the end of a radial line where every megawatt travels the same conductor. Tapping a line versus building into an existing substation changes the contingency set too. A credible screen therefore evaluates several POIs at several injection levels and reports a headroom curve for each, naming the element that binds first.
What public data exists, and what does not
ISO and RTO base cases are the foundation, and most are classified as Critical Energy Infrastructure Information. Access requires a CEII agreement with the ISO or FERC, and the files cannot be redistributed. Without them, a screen works from an approximation of the network built from public geography and published results.
A great deal is public. ISOs publish cluster study reports, individual feasibility and system impact studies, and transmission planning reports that name constrained elements and planned upgrades. Queue databases show what is proposed at each substation. Utility hosting capacity maps cover distribution-level headroom. Federal and state datasets show transmission routes, voltages, and substation locations, and FERC Form 715 filings contain planning criteria.
Generally not public: real-time or historical line loadings, protection settings, precise breaker ratings, planned reconfigurations, and the utility internal load growth assumptions. A screen that claims precision without these inputs is overselling. The honest posture is to calibrate an approximate model against published study results for nearby projects.
A developer screen versus the utility system impact study
The system impact study is the utility formal determination of the network upgrades your project triggers and their estimated cost. It uses the confidential model, the full contingency list, the official planning criteria, and the live queue, and its findings are contractually meaningful. A developer screen approximates that analysis with less data, earlier, and for many candidates at once.
Independent screening can tell you the relative ranking of candidate POIs, the approximate injection level where constraints begin to bind, which elements are likely to be the problem, and whether your size is plausible for that location. It can flag sites where upgrade exposure is obvious before deposits are paid.
It cannot tell you the exact upgrade cost, the cost allocation across a cluster, the outcome of a stability study, or how the utility will treat prior-queued projects that later withdraw. Treat it as a probabilistic estimate of what the utility study will say, not a substitute for it.
How to interpret screening results
Read the output in three layers. Headroom is the injection level at which the first constraint reaches its limit under the worst contingency. If your project fits below that level in every seasonal case, you are likely looking at a low-upgrade interconnection. If it fits in most cases but not all, you are looking at curtailment risk rather than a hard upgrade requirement.
Curtailment risk means the constraint binds only during specific hours or outages, and the operator can manage it by reducing your output rather than building. Many projects accept this where the binding case is rare. Estimating how often it occurs requires hourly or seasonal cases and an energy model that values the lost production.
Upgrade triggers are constraints that bind in the base case or in frequent contingencies. When a transformer reaches its rating before you reach a viable size, the question becomes whether the fix is modest, such as reconductoring a short segment, or major, such as a new transformer or line. Published studies for nearby projects often show what the utility previously required for that element.
Typical mistakes
The most common error is ignoring prior-queued projects. A substation with apparent headroom today may have hundreds of megawatts ahead of it, and the utility models those first. Second is running N-0 only. Third is checking a single season; light-load voltage problems do not appear in a summer peak case.
Other recurring mistakes: modeling storage as a generator only, assuming a line tap has the same headroom as a substation bus, treating a distribution hosting capacity map as a transmission answer, and reading a neighboring project study result as if it applied to yours. Each produces optimistic headroom, the expensive direction to be wrong. Teams also stop at a headroom number without asking what binds, though the limiting element is what determines cost and schedule.
Turning the screen into a filing decision
The screen should end in four decisions. Size: choose the capacity that fits under the headroom curve in the cases that matter, or deliberately oversize and accept curtailment where the economics support it. POI: pick the location with the most robust headroom across contingencies, not the one closest to the parcel. Storage: if the binding constraint is hourly, pairing storage and charging off peak can convert a curtailment problem into a dispatch problem.
Then decide whether to proceed. If the project cannot fit without a major upgrade, and published studies confirm the utility has assigned that upgrade to neighbors, not filing preserves capital for a better site. If the result is borderline, filing at a reduced size or in a later cluster window keeps the option alive at lower risk.
Modern screening tools such as Basepoint bring transmission maps, queue data, published study results, and power flow analysis into one workflow so this comparison can run across many sites before the first application is drafted. The value is not in avoiding the utility study. It is in arriving at that study with a project the network can plausibly absorb.